Key points
- The 38 listed makers of bare circuit boards studied here sold US$50.9 billion in 2025, 22.0% more than the same companies sold in 2024 (year on year, in US$), and spent 15.2% of their sales on new plant and equipment.[1][2][3]
- Once full, a plant sells about what it cost each year. The median maker's annual sales were 1.07 times the capital spending of the previous ten years; the middle 80% of cases ran from 0.71 to 2.28 times.
- Filling a plant pays. Within the same company, one more turn of the plant (one more unit of annual sales per unit of plant on the books) came with 5.5 percentage points more gross margin.
- Makers invest in the year their orders grow. Their spending does not predict extra growth in later years, and machine learning on the accounts predicted next year's growth only slightly better than assuming no change at all.
- The plant already built could carry 26.5% more sales at each maker's usual pace, and plant still under construction reached 15.2% of the Chinese makers' plant in 2025.
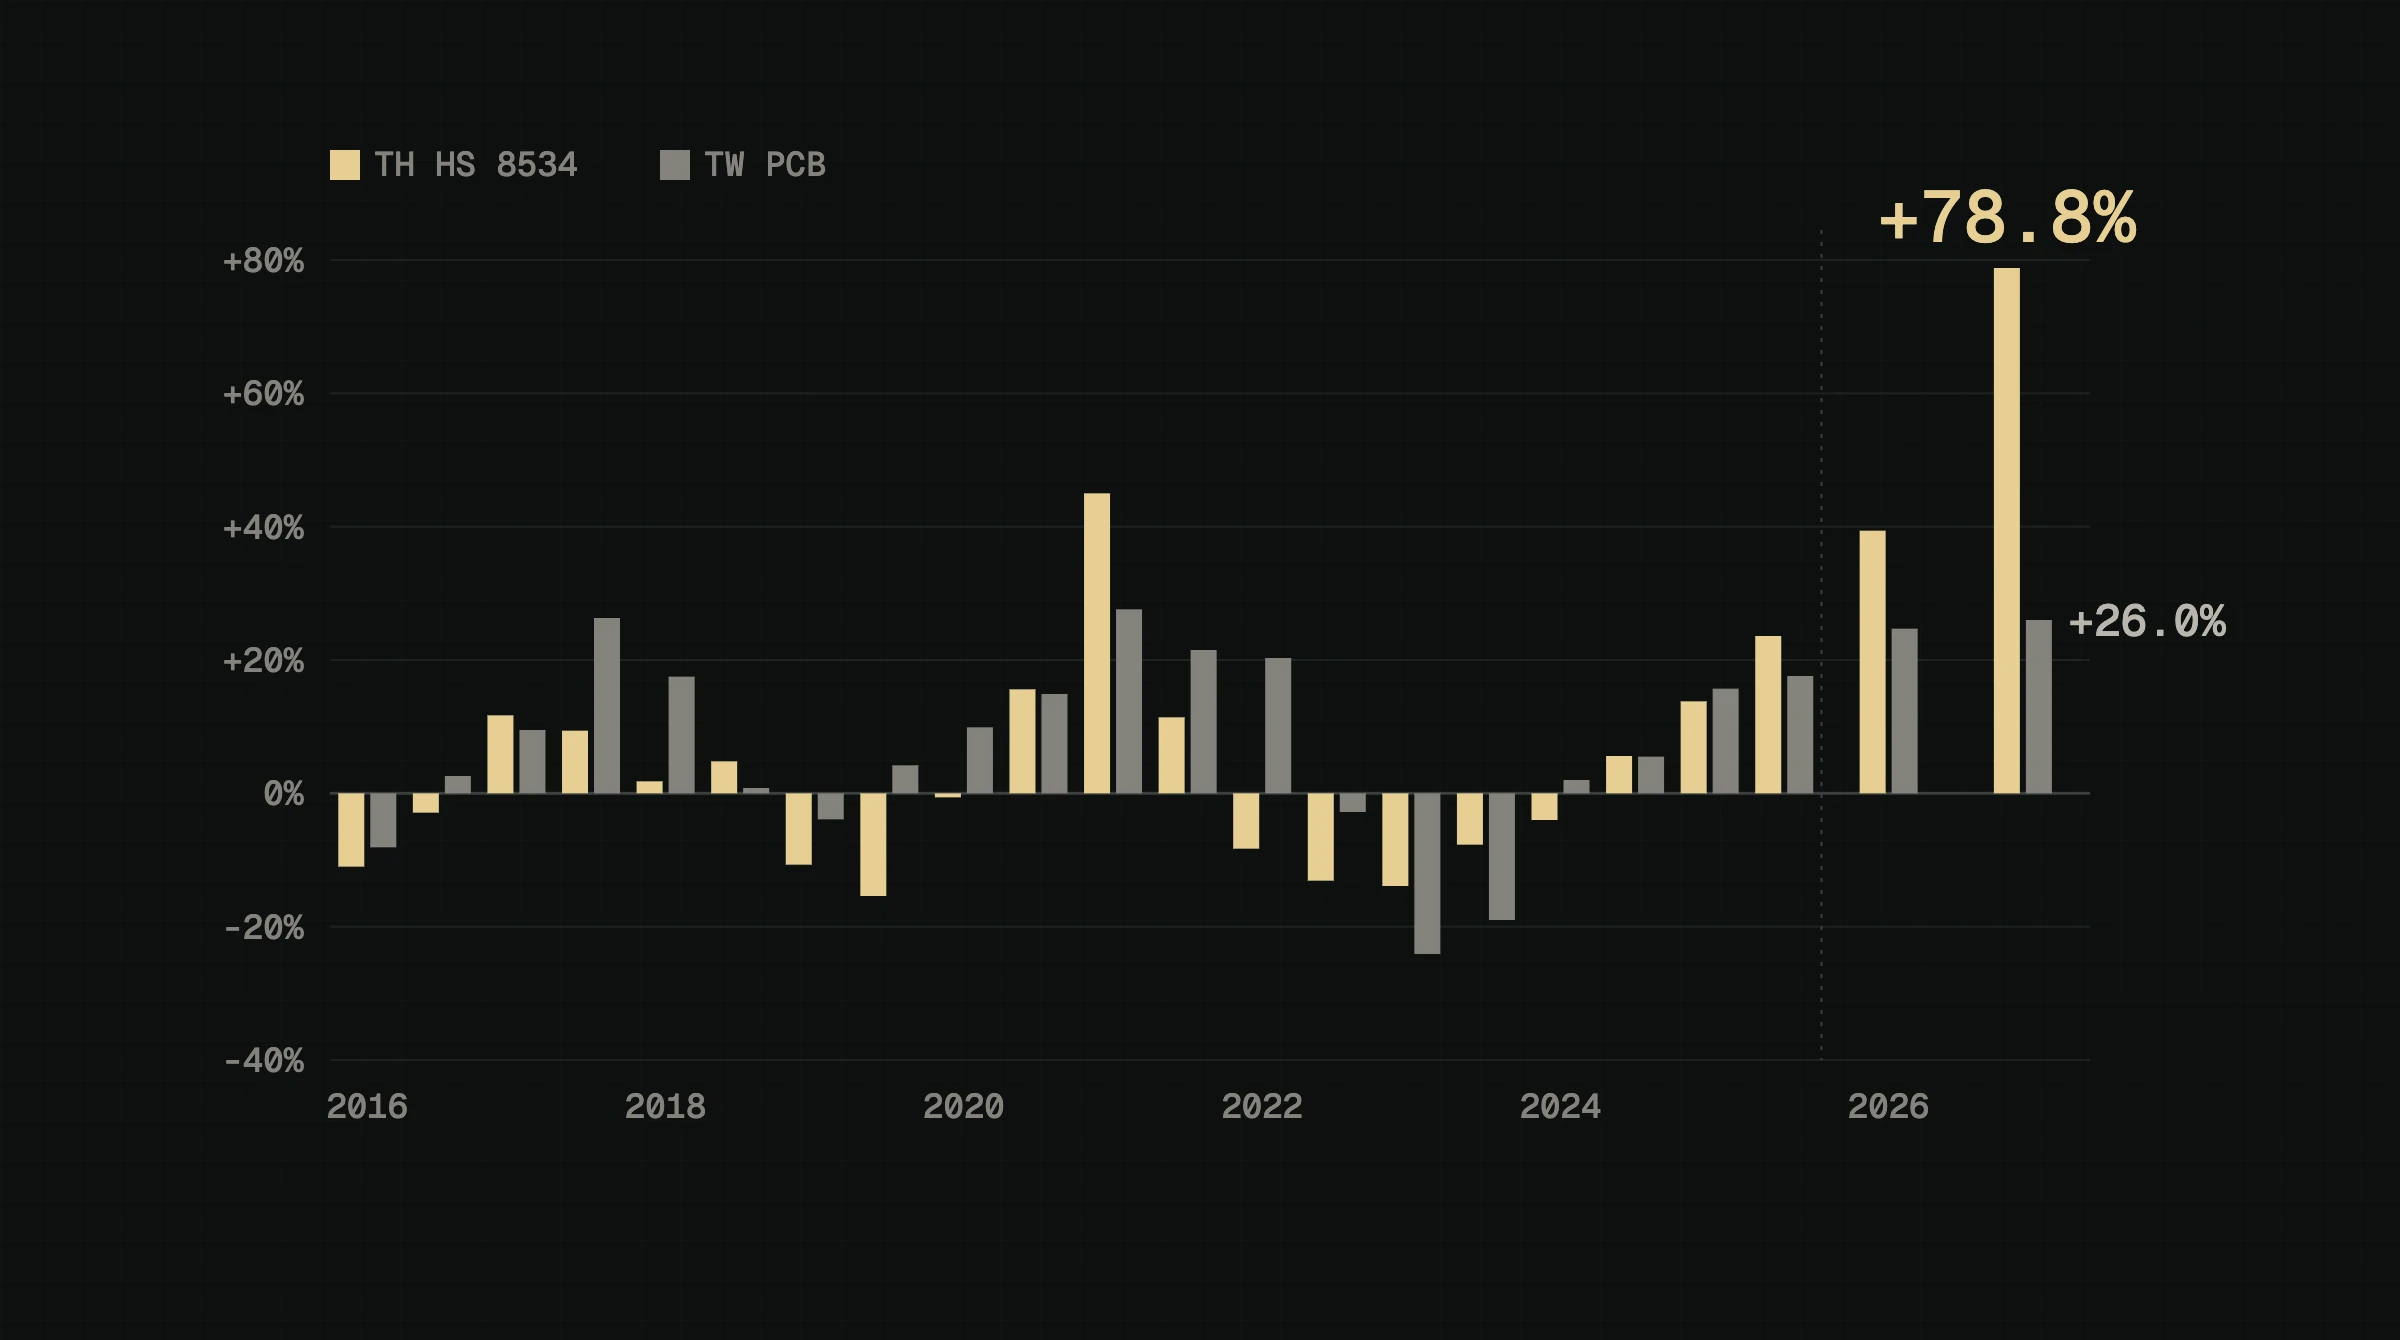
- Thailand's exports and the Taiwanese makers' sales grew together until 2025. In 2026 Thailand pulled ahead: +39.4% from January to May against +24.7%, and +78.8% in July against +26.0%.[7][8][2]
Why the accounts matter now
Thailand's PCB boom is being paid for by companies whose accounts are public. Of the 38 makers in this study, 28 own or are building a plant in Thailand, according to the MPBxChange register of plants. Their filings show what a plant costs, what it sells once it is full, and how margins behave while it fills. Those are the numbers a buyer needs when talking to a new plant, and the numbers a plant needs when planning its ramp.
This article reads the filings as one data set, then tests what they can and cannot predict. It is industry research about operating figures, not a view on any company's shares.
The data
The data set holds every published annual figure the open sources carry for 43 listed companies, 42 of which enter the analysis:
- 26 companies listed in Shanghai and Shenzhen: income statements, balance sheets, cash flow statements and product segments from their annual reports.[1] Avary Holding is left out of the analysis because Zhen Ding Technology, listed in Taipei, consolidates it; counting both would count it twice.
- 16 companies listed in Taipei, 13 board makers and 3 makers of laminate: quarterly statements and monthly revenue as filed on the Market Observation Post System.[2]
- KCE Electronics, the listed Thai maker, from its One Reports filed with Thailand's Securities and Exchange Commission.[3][4][5]
Levels are converted to US$ at annual average exchange rates; every ratio uses one currency, so no exchange rate enters it.[6] A company counts as a board maker in a year when boards are at least 60% of its main business, which keeps Dongshan Precision in (boards were 63.9% of its 2025 business) and keeps the laminate makers out.[1] That leaves 507 company-years from 2012 to 2025, 38 board makers in 2025.
The industry in the accounts
| Year | Makers | Sales, US$ billion | Capital spending, % of sales | Gross margin | Growth, same makers |
|---|---|---|---|---|---|
| 2016 | 29 | 17.3 | 8.8% | 16.9% | +1.6% |
| 2017 | 32 | 21.2 | 9.8% | 17.2% | +20.0% |
| 2018 | 33 | 23.8 | 10.7% | 19.2% | +11.9% |
| 2019 | 35 | 28.5 | 10.8% | 20.3% | +5.0% |
| 2020 | 36 | 32.7 | 13.7% | 20.2% | +13.4% |
| 2021 | 36 | 41.6 | 16.9% | 20.5% | +27.2% |
| 2022 | 37 | 43.8 | 16.4% | 24.0% | +3.5% |
| 2023 | 38 | 38.0 | 15.1% | 19.6% | -14.2% |
| 2024 | 38 | 41.7 | 12.8% | 19.3% | +9.7% |
| 2025 | 38 | 50.9 | 15.2% | 21.3% | +22.0% |
Growth compares the same companies in both years (year on year, in US$), so a newly listed maker does not count as growth. Sales rise with the number of makers as companies list; the growth column is the one to read.
Capital spending peaked at 16.9% of sales in 2021, eased to 12.8% in 2024 and rose again to 15.2% in 2025, when the makers spent US$7.8 billion. Gross margin stayed between 16.9% and 24.0% through the cycle.
What a plant sells once it is full
An announced investment is a cost: land, buildings and machines. The question for a buyer or a plant is how much output that cost buys. The accounts answer it two ways.
Sales per unit of ten years' capital spending. Plant in use is roughly what a company has spent on plant over the last ten years, so this ratio compares sales with what the plant cost. It needs ten years of cash flow statements, which 30 of the 38 makers have.
- Take a year's sales. Shenzhen Kinwong Electronic sold CNY 15.31 billion in 2025.[1]
- Add the cash it paid for plant and equipment in that year and the nine before it: CNY 0.34 billion in 2016 rising to CNY 2.77 billion in 2025, CNY 14.60 billion in all.[1]
- Divide: 15.31 / 14.60 = 1.05. Kinwong's 2025 sales were 1.05 times its ten years of spending, close to the median of all makers.
Sales per unit of plant on the books. Net property, plant and equipment is plant at cost less depreciation, plus construction in progress. Because old plant is written down, this ratio runs higher.
- KCE Electronics' revenue from operations was THB 13,074.69 million in 2025.[3]
- Its plant on the books was THB 7,645.37 million at the end of 2024 and THB 7,267.23 million at the end of 2025; the average is THB 7,456.30 million.[3]
- Divide: 13,074.69 / 7,456.30 = 1.75.
Across the data set:
| Measure | Low (10th percentile) | Median | High (90th percentile) | Company-years |
|---|---|---|---|---|
| Sales per unit of ten years' capital spending | 0.71 | 1.07 | 2.28 | 115 |
| Sales per unit of plant on the books | 1.16 | 1.97 | 3.53 | 342 |
The first measure is the one to set against an announcement. At the median, a THB 10 billion plant supports about THB 10.7 billion of sales a year once it is full, with a range of THB 7.1 billion to THB 22.8 billion between the low and the high case. The spread is the uncertainty: a plant making high-layer boards for servers sells more per baht of equipment than one making simpler boards. The second measure is an upper bound, because it flatters old, depreciated plant.
Filling a plant pays
A plant's costs are mostly fixed: depreciation, power, staff. So margin should rise as the same plant makes more. The accounts say how much.
- For each company-year, divide sales by average plant on the books. Call it turns.
- Regress gross margin on turns, comparing each company only with itself and taking out each year's industry-wide swing (company and year effects, errors clustered by company).
- Result: each extra turn comes with 5.5 percentage points more gross margin (standard error 0.9 points; 406 company-years). The 95% range is 3.7 to 7.3 points.
A new plant starts well below the industry's median of about 2 turns, because its plant is on the books before its sales are. As it fills from 1 turn to 2, the accounts suggest its gross margin rises by about 5 points. A year of heavy spending did not measurably cut the next year's margin (the estimate was +0.07 per unit of spending over sales, not significant).
Makers invest in the year their orders grow
Does spending lead growth, or follow it? Both directions can be tested with the same company and year effects.
- Spending as a share of the previous year's sales rises by 0.20 for each unit of growth in the same year (standard error 0.04, 368 company-years). Last year's growth adds nothing measurable (+0.03, not significant). A maker growing 20% spends about 4% of last year's sales more that year.
- Sales growth rises with the same year's spending (0.70 per unit, standard error 0.16), but spending one, two or three years earlier adds nothing significant (coefficients -0.22, -0.09 and +0.17).
The spending follows the orders. An announced plant is a sign of demand the company already sees, not a bet on demand it hopes for. The Thai investors fit this pattern: the 28 makers with a plant in Thailand grew 13.6% in 2024 while the other 10 shrank 3.4%, and in 2025 they spent 16.6% of their sales on plant against 9.9% for the others.
Can the accounts predict next year?
To test this fairly, each model was trained only on years before the year it predicted, then scored on that year, for every year from 2019 to 2025: 249 predictions of a company's growth in the following year. The inputs were 13 figures from the accounts, among them growth this year and last, spending, margins, turns, size and the industry's growth.
| Method | Average miss, percentage points of growth | Direction right |
|---|---|---|
| Ridge regression | 15.1 | 55% |
| Random forest | 15.3 | 56% |
| Gradient boosting | 15.6 | 56% |
| Industry growth this year | 17.1 | 49% |
| No change | 17.1 | 49% |
| This year's growth again | 17.2 | 55% |
The best model misses by 15.1 points on average, 12% better than assuming no change, and picks the direction little better than a coin. Growth next year is set by orders the accounts cannot see, such as a customer's new server programme. This matches a long line of research on company growth, which finds "scant persistence in growth beyond chance".[9] For a buyer, the practical point is to judge a plant on what it can make and whom it already makes it for, not on last year's growth.
The plant already built
Two figures show how much capacity the accounts already hold.
- Multiply each maker's plant on the books at the end of 2025 by its own median turns over 2016 to 2025. Summed, that plant could carry US$64.4 billion of sales a year at the makers' usual pace.
- Their 2025 sales were US$50.9 billion. The plant already built could carry 26.5% more.
- For the 28 makers with a plant in Thailand: US$49.9 billion of capacity against US$40.8 billion of sales, 22.3% more.
Plant still under construction was 15.2% of the Chinese makers' plant on the books at the end of 2025, against 6.4% in 2016. Much of it is in the new plants abroad, Thailand among them.
Thailand has pulled ahead
Show the numbers
| Period | Thailand's exports, % | Taiwanese makers' sales, % |
|---|---|---|
| 2016 H1 | -11 | -8.1 |
| 2016 H2 | -2.9 | +2.6 |
| 2017 H1 | +11.7 | +9.5 |
| 2017 H2 | +9.4 | +26.3 |
| 2018 H1 | +1.8 | +17.5 |
| 2018 H2 | +4.8 | +0.8 |
| 2019 H1 | -10.7 | -3.9 |
| 2019 H2 | -15.4 | +4.2 |
| 2020 H1 | -0.6 | +9.9 |
| 2020 H2 | +15.6 | +14.9 |
| 2021 H1 | +45 | +27.6 |
| 2021 H2 | +11.4 | +21.5 |
| 2022 H1 | -8.3 | +20.3 |
| 2022 H2 | -13.1 | -2.8 |
| 2023 H1 | -13.9 | -24.1 |
| 2023 H2 | -7.7 | -19 |
| 2024 H1 | -4 | +2 |
| 2024 H2 | +5.6 | +5.5 |
| 2025 H1 | +13.8 | +15.7 |
| 2025 H2 | +23.6 | +17.6 |
| Jan to May 2026 | +39.4 | +24.7 |
| Jul 2026 | +78.8 | +26 |
The 12 Taiwanese makers with a complete monthly record publish their sales about ten days after each month ends; Thailand's customs figures reach UN Comtrade two to three months later.[2][7] From 2016 to 2025 the two growth rates moved together: the correlation between them, month by month, is 0.65.
That link was tested as an early read on Thai exports. Fitted only on months already published and scored from 2019, it missed by 11.7% on average, against 11.2% for simply repeating the growth rate of three months earlier: no better than the simple rule. In 2026 the gap opened. From January to May, Thailand's exports rose 39.4% while the Taiwanese makers' sales rose 24.7%.[7][2] In July, Thailand's printed circuit exports reached US$232 million, up 78.8%, while the makers' sales rose 26.0%.[8][2] A model fitted on the makers' sales put July at US$168 million, with an 80% range of US$146 to 191 million. Thailand came in above the top of that range.
The difference is the new capacity in Thailand. The makers' own sales grow with the industry; Thailand's exports grow with the industry plus the plants that have opened there since 2024. The export forecast sets out what the trade data suggest for the years to 2030.
What it means for buyers and plants
- For buyers: the capacity is there. Makers with a plant in Thailand could carry about a fifth more sales on plant they have already built, and a new plant earns more margin with every order it adds. That is the moment to ask for capacity commitments, samples and qualification support.
- For plants: at the median, each THB 1 billion invested supports about THB 1.07 billion of sales a year once full, and margin rises about 5 points for each extra turn. Filling the plant quickly matters more than any other figure in these accounts, and being easy to find by buyers is part of filling it.
- For both: an announcement is a signal of demand already seen. Its size, set against the ratios above, says roughly how much output is coming.
Limits
- Only listed companies with open filings are included. Japanese and Korean makers, several of which have Thai plants, are not, and Thailand is represented by one listed maker.
- Consolidated accounts mix plants in several countries. The ratios describe companies, not any single plant.
- The ten-year spending measure needs ten years of cash flows, which 30 of the 38 makers have. Younger companies are in the other measures only.
- Growth in US$ includes exchange-rate movements. Ratios do not.
- The regressions show how figures move together within companies over time, net of each year's industry swing. They do not prove cause.
- The prediction test is small: 249 predictions over seven years. Better inputs, such as order books, may do better than the accounts can.
- Two figures were corrected: the data source stores Compeq's and HannStar Board's 2020 capital spending with the sign reversed; the amounts, which match their nine-month figures, were used as outflows.
- July 2026 comes from Thailand's Office of Industrial Economics; UN Comtrade has not yet published it, and figures can be revised.
How this was researched
This article was researched on 26 September 2026. Annual figures for 26 Chinese makers came from the Eastmoney datacenter, which carries the statements filed with the Shanghai and Shenzhen exchanges;[1] quarterly and monthly figures for 16 Taiwanese companies from FinMind, which carries the filings on the Market Observation Post System;[2] and KCE Electronics' figures from its One Reports for 2021, 2022 and 2025, filed with Thailand's Securities and Exchange Commission.[3][4][5] Exchange rates are FRED annual and monthly averages.[6] Thailand's exports are its monthly returns to UN Comtrade and, for July 2026, the Office of Industrial Economics.[7][8] Every raw response was saved, and one script builds the data set and another runs every calculation here, with fixed random seeds, so each figure can be reproduced. The regressions use company and year effects with errors clustered by company; the prediction test trains each model on earlier years only. Plant counts come from the MPBxChange register of PCB plants in Thailand.
Sources
- data Eastmoney (East Money Information Co., Ltd.) (2026). F10 financial data: income statements, balance sheets, cash flow statements and product segments from the annual reports of 26 companies listed on the Shanghai and Shenzhen stock exchanges (the link opens Shenzhen Kinwong Electronic's cash flow statements). Eastmoney datacenter. back to text
- data FinMind (2026). Taiwan stock financial statements, balance sheets, cash flow statements and monthly revenue, as filed on the Market Observation Post System by 16 companies listed on TWSE and TPEx (the link opens Compeq Manufacturing's monthly revenue). FinMind open data API. back to text
- company KCE Electronics Public Company Limited (2026). Annual Registration Statement / Annual Report 2025 (Form 56-1 One Report). Securities and Exchange Commission, Thailand. back to text
- company KCE Electronics Public Company Limited (2023). Annual Report 2022 (56-1 One Report). Securities and Exchange Commission, Thailand. back to text
- company KCE Electronics Public Company Limited (2022). Annual Report 2021 (56-1 One Report). Securities and Exchange Commission, Thailand. back to text
- data Board of Governors of the Federal Reserve System, via Federal Reserve Bank of St. Louis (2026). FRED: annual average exchange rates, Chinese yuan, Taiwan dollar and Thai baht to one US dollar (AEXCHUS, AEXTAUS, AEXTHUS), and the monthly series EXCHUS, EXTAUS. FRED, Federal Reserve Bank of St. Louis. back to text
- data United Nations Statistics Division (2026). UN Comtrade: Thailand, HS 8534 printed circuits, exports and imports, monthly, January 2015 to May 2026 (the link opens May 2026; change the period for other months). UN Comtrade database, public API. back to text
- official Office of Industrial Economics (OIE), Ministry of Industry (2026). ภาวะเศรษฐกิจอุตสาหกรรม เดือนกรกฎาคม 2569 (Industrial economic conditions, July 2026). Office of Industrial Economics. back to text
- academic Louis K. C. Chan, Jason Karceski and Josef Lakonishok (2003). The Level and Persistence of Growth Rates. The Journal of Finance, 58(2), 643-684. back to text
How to cite: MPBxChange (2026). What 38 listed PCB makers' accounts say about Thailand's build-out. MPBxChange research. https://www.mpbxchange.com/research/what-listed-pcb-makers-accounts-say-2026