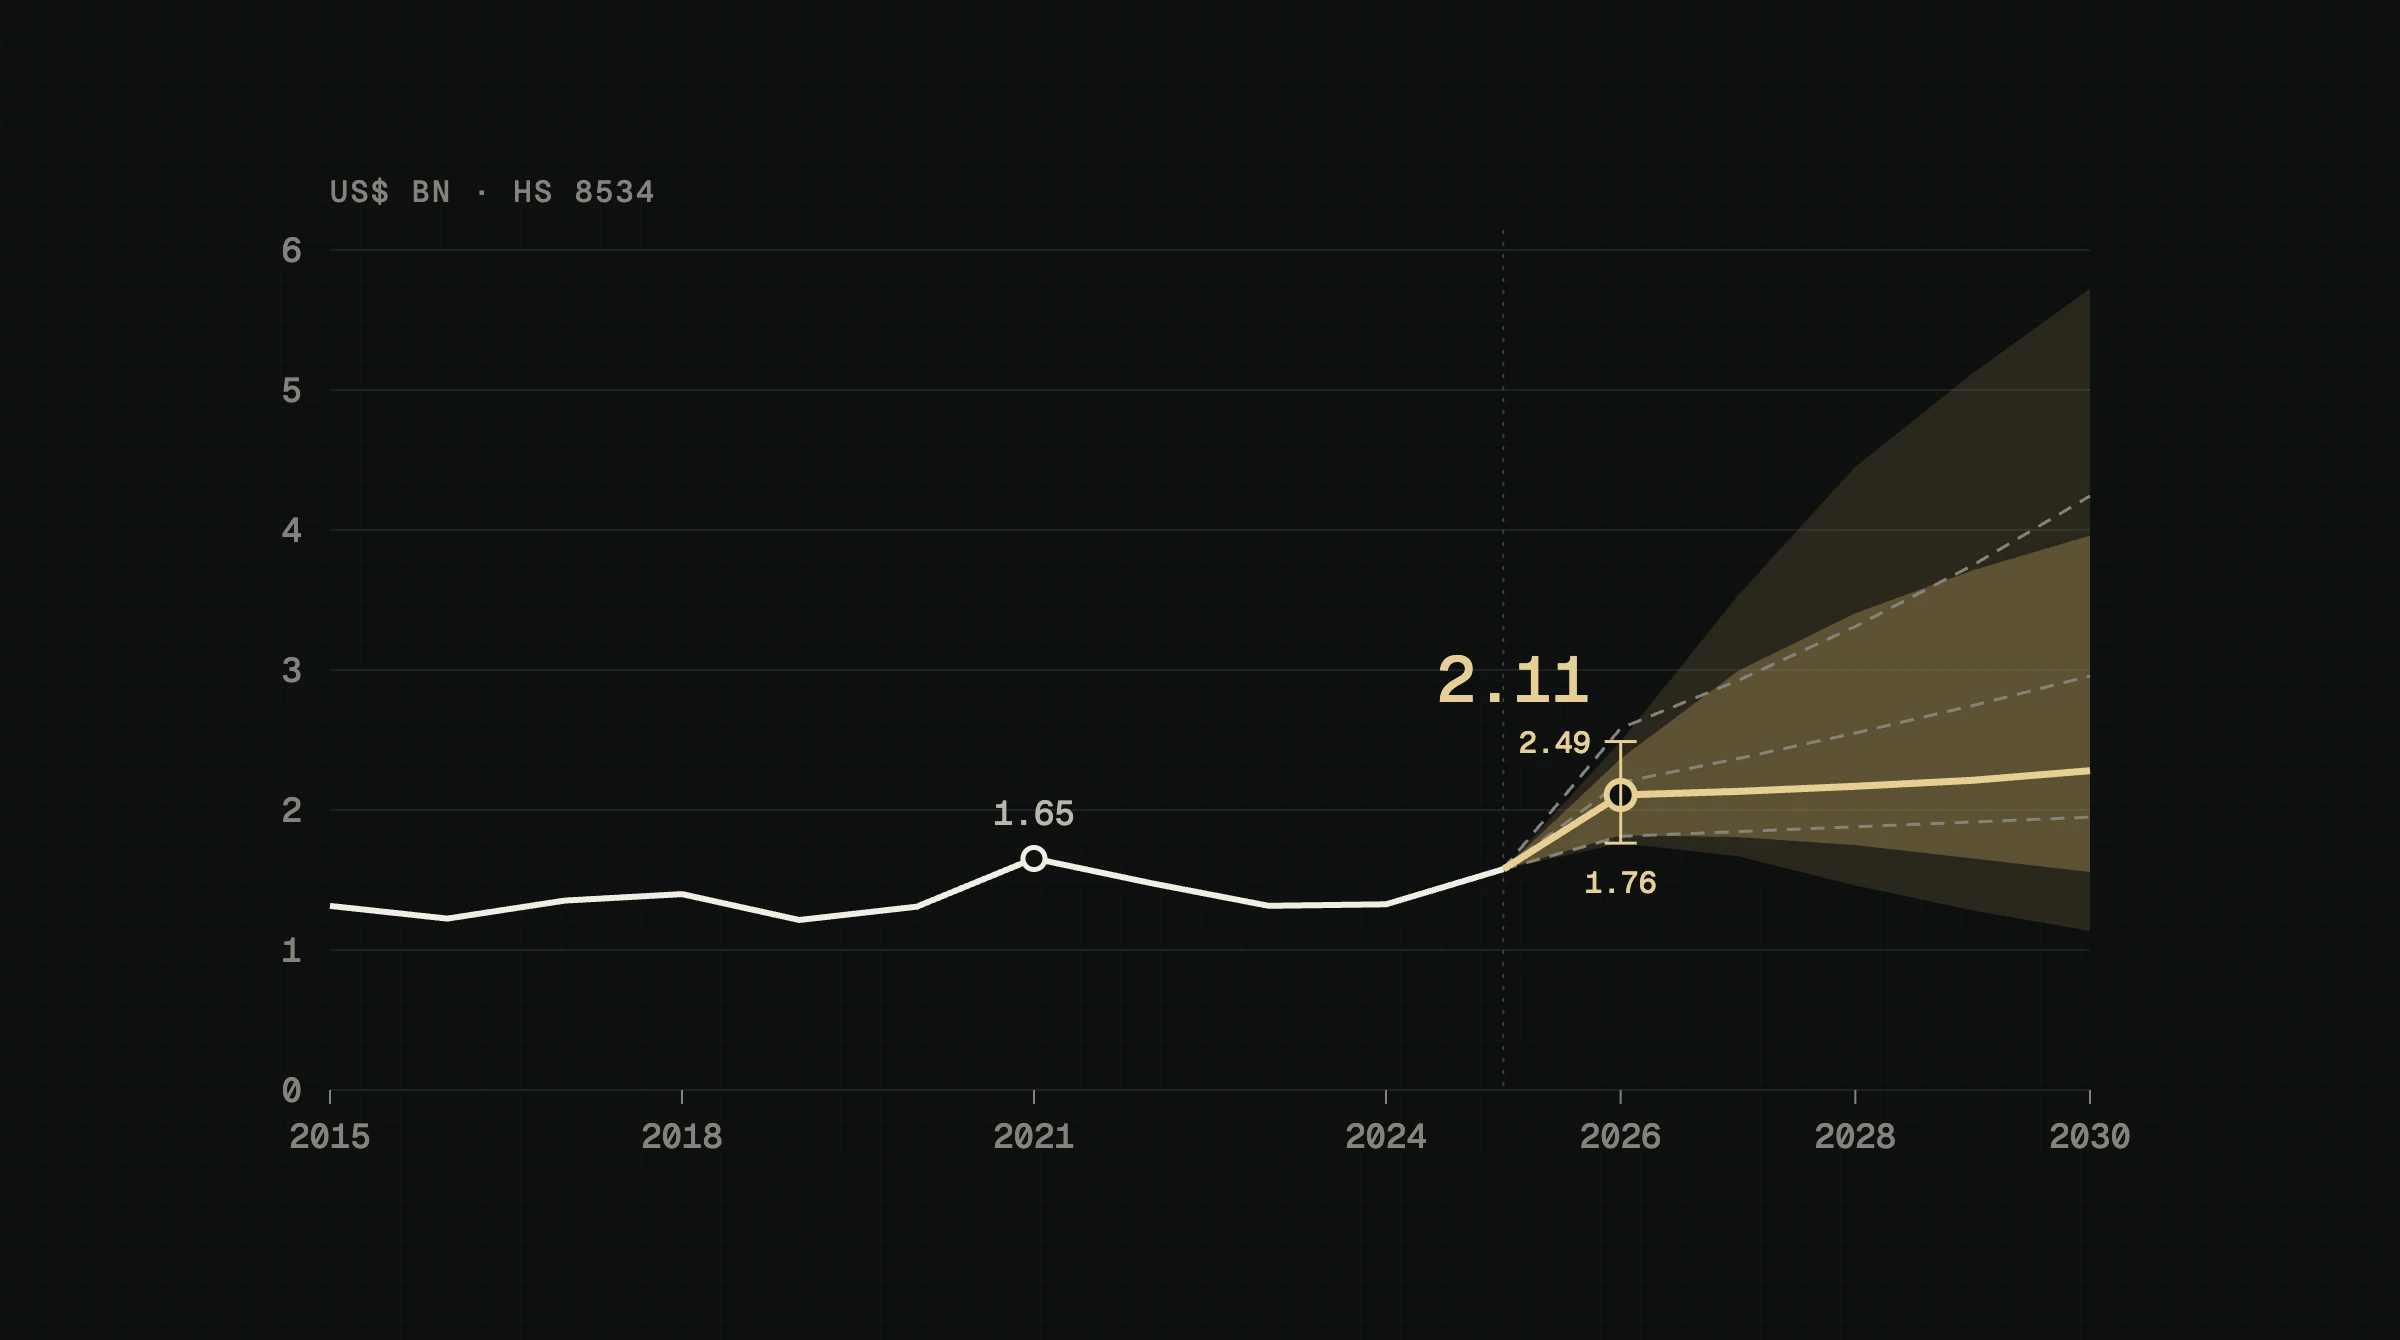
Thailand exported US$833.4 million of bare printed circuit boards in the first five months of 2026, 39.4% more than in the same months of 2025.[1] The Office of Industrial Economics (OIE) reports that exports of printed circuits reached US$232 million in July 2026 alone, 78.8% more than a year earlier.[4] This article asks what Thailand's own trade returns suggest for the rest of the decade. A forecasting model, chosen because it made the smallest errors when tested on 22 past starting points, puts 2026 exports at US$1.76 to 2.49 billion with 95% probability, most likely about US$2.11 billion. Every value in that range is above the previous annual record of US$1.65 billion, set in 2021.[2]
Key points
- 2026 is on course for a record. The model's range for the year is US$1,819 to 2,367 million (80%) and US$1,763 to 2,489 million (95%), against US$1,576.9 million in 2025.[1][2]
- The current pace is at the top of that range. July's US$232 million is above the model's 80% range for the month.[4]
- The range for 2030 is wide. The most likely value is US$2.28 billion, but the 80% range runs from US$1.56 to 3.96 billion.
- Scenarios use published growth rates only. They put 2030 exports at US$1.95, 2.96 or 4.24 billion.[2][6][7]
- The method is plain. The chosen model averages three standard methods; its forecasts of a coming year's total were off by 10.3% on average in testing.
Why the trade data matter now
HS 8534 is the customs heading for bare printed circuit boards. In 2024 Thailand exported US$1,326.2 million of them, seventh among the 114 economies that reported to UN Comtrade, and close behind Malaysia at US$1,367.5 million.[3] Thailand also buys more boards than it sells: imports were US$3,541.8 million in 2025, against exports of US$1,576.9 million.[2]
The growth comes with a wave of new plants. Nikkei Asia counted nearly 60 PCB makers from China and Taiwan setting up in Thailand in less than three years.[9] In the MPBxChange register, 28 of the 39 plants that publish a founding year were registered in Thailand from 2022 onwards, and 6 plants are under construction or announced. Industry forecasts point the same way. Prismark, as quoted by WUS Printed Circuit, expects Asia outside China and Japan, especially Southeast Asia, to be the fastest-growing region to 2030, at 13.2% a year against 11.0% for the world.[7] Victory Giant quotes Prismark's rate for China at 10.5% a year.[8]
New plants take time to reach full output, so their effect shows up in the trade figures with a lag. That is why a careful reading of the monthly returns is useful: it shows how much of the investment has already turned into exports.
Show the numbers
| Month | Exports, US$ m | Imports, US$ m |
|---|---|---|
| 2025-01 | 107.2 | 259.1 |
| 2025-02 | 124.8 | 214 |
| 2025-03 | 123.6 | 248.4 |
| 2025-04 | 116.5 | 249.9 |
| 2025-05 | 125.7 | 270.7 |
| 2025-06 | 125.6 | 279.1 |
| 2025-07 | 129.4 | 308.8 |
| 2025-08 | 132.6 | 297.5 |
| 2025-09 | 153.3 | 314.4 |
| 2025-10 | 152.3 | 365.6 |
| 2025-11 | 137.2 | 359.5 |
| 2025-12 | 148.7 | 374.8 |
| 2026-01 | 151.5 | 468.3 |
| 2026-02 | 144.2 | 404.2 |
| 2026-03 | 177.7 | 490.7 |
| 2026-04 | 166.7 | 462.9 |
| 2026-05 | 193.1 | 451.8 |
The data
The forecast uses Thailand's monthly returns to UN Comtrade for HS 8534, from January 2015 to May 2026: 137 months with no gaps.[1] The months add up to the annual returns within US$0.3 million for every year from 2015 to 2025.[2] OIE's monthly reports use a 'printed circuit' line that tracks the same goods closely. Its July 2026 figure implies US$129.8 million for July 2025, against US$129.4 million in UN Comtrade.[4][1] Its December 2025 figure of US$151.7 million, up 39.1%, implies US$109.1 million for December 2024, against US$108.2 million.[5][1] The OIE months after May 2026 can therefore be used to check the forecast before UN Comtrade publishes them.
How the forecast was made
Five methods were compared. The simplest repeats the same month of the previous year. Two standard statistical models follow the level, trend and seasonal pattern of the series: exponential smoothing with a damped trend, and seasonal ARIMA. A fourth fits a trend whose slope may change in June 2023, the median registration month of the plants registered in Thailand from 2022 in the MPBxChange register. The fifth is an equal-weight average of the first three; averaging several methods is a well-tested way to improve accuracy.[12]
Each method was tested the way it would be used. At 22 starting points, every three months from December 2019 to March 2025, it was given only the data up to that month and asked for the next 12 months. This is known as evaluation on a rolling forecasting origin.[11] Errors were measured three ways: the average percentage error per month (MAPE), the mean absolute scaled error (MASE), which compares the error with that of repeating last year's month,[10] and the percentage error on the 12-month total.
| Method | Monthly error (MAPE) | MASE | Error on the 12-month total |
|---|---|---|---|
| Average of three methods | 11.7% | 1.13 | 10.3% |
| Seasonal ARIMA | 12.0% | 1.14 | 10.6% |
| Exponential smoothing, damped trend | 12.9% | 1.23 | 11.1% |
| Same month last year | 13.7% | 1.31 | 11.8% |
| Trend with a 2023 break | 32.3% | 2.95 | 24.1% |
The average of three methods made the smallest errors and is used for the forecast. The trend with a break made the largest: it projects the steepest part of the series forward, which the test shows is not a safe guide. The forecast ranges are prediction intervals: ranges expected to hold the outcome with a stated probability.[13] They were checked too. In the test, the 80% ranges held 81% of the months that followed and the 95% ranges 94%, close to what they claim. Most misses came at upturns, in 2020 and from late 2024, when exports rose faster than the model expected.
The forecast
Show the numbers
| Year | Most likely, US$ m | 80% low | 80% high | 95% low | 95% high | Scenario low | Scenario base | Scenario high |
|---|---|---|---|---|---|---|---|---|
| 2026 | 2,107 | 1,819 | 2,367 | 1,763 | 2,489 | 1,812 | 2,198 | 2,584 |
| 2027 | 2,133 | 1,807 | 2,993 | 1,670 | 3,532 | 1,846 | 2,367 | 2,925 |
| 2028 | 2,169 | 1,749 | 3,406 | 1,461 | 4,451 | 1,880 | 2,550 | 3,311 |
| 2029 | 2,212 | 1,654 | 3,712 | 1,283 | 5,120 | 1,914 | 2,746 | 3,748 |
| 2030 | 2,281 | 1,557 | 3,960 | 1,136 | 5,723 | 1,949 | 2,957 | 4,243 |
| Year | Most likely, US$ million | 80% range | 95% range |
|---|---|---|---|
| 2026 (5 months reported) | 2,107 | 1,819 to 2,367 | 1,763 to 2,489 |
| 2027 | 2,133 | 1,807 to 2,993 | 1,670 to 3,532 |
| 2028 | 2,169 | 1,749 to 3,406 | 1,461 to 4,451 |
| 2029 | 2,212 | 1,654 to 3,712 | 1,283 to 5,120 |
| 2030 | 2,281 | 1,557 to 3,960 | 1,136 to 5,723 |
For 2026 the five reported months already account for US$833.4 million, so the range is narrow. The most likely value, US$2,107 million, is 33.6% above 2025. After 2026 the most likely path rises slowly, to US$2,281 million in 2030, while the ranges widen quickly. The model reads 2026 as a step up and cannot tell from the data alone whether a new trend has begun.
The July figure suggests the upper part of the range is more likely. The model's most likely value for July 2026 was US$184 million, with an 80% range of US$120 to 218 million; OIE reported US$232 million.[4] That is the same pattern as the misses in the test: statistical models are slow to follow a rise that new capacity is driving.
Three scenarios from published growth rates
The scenarios below are not forecasts. Each one starts from the 2026 months already reported and then applies one published growth rate, so the reader can see what each view of the market would mean for Thailand's exports.
| Scenario | 2026 | 2027 | 2028 | 2029 | 2030 |
|---|---|---|---|---|---|
| Low | 1,812 | 1,846 | 1,880 | 1,914 | 1,949 |
| Base | 2,198 | 2,367 | 2,550 | 2,746 | 2,957 |
| High | 2,584 | 2,925 | 3,311 | 3,748 | 4,243 |
US$ million. Low adds the rest of 2025's months to the 2026 months reported (US$833.4 plus US$979.0 million), then grows at 1.8% a year, Thailand's own average from 2015 to 2025.[2] Base holds the January to May growth for the whole of 2026 (US$1,576.9 million times 1.394), then grows at 7.7% a year, Prismark's world forecast in its fourth-quarter 2025 report.[6] High applies July's 78.8% growth to the rest of 2026,[4] then grows at 13.2% a year, Prismark's rate for Asia outside China and Japan.[7] The base path stays inside the model's 80% range in every year. The high path is above the model's range in 2026, because it assumes July's pace lasts seven months.
What it means for buyers and plants
For buyers, the numbers describe a supply base that is getting larger quickly: more plants, more capacity and more boards leaving Thailand every month. For plants in Thailand, the import figures point to demand close to home. Thailand imported US$3,541.8 million of bare boards in 2025,[2] and OIE reported that imports of printed circuits in December 2025 were 91.93% higher than a year earlier.[5] The same method applied to imports (seasonal ARIMA, with an average error of 14.8% on the 12-month total) puts 2026 imports at US$5.08 to 6.50 billion (80%). Some of that demand is open to plants that make the same boards in Thailand.
Limits
The series is short for a five-year forecast: 137 months that hold one pandemic cycle and a relocation wave still under way. The models see only past trade, not new plants or orders, which is why they lag at upturns. Recent months can be revised, and HS 8534 counts bare boards only: boards that leave Thailand inside finished products are counted under those products. Prismark's figures are as quoted in listed companies' filings. The scenarios are conditional paths, not forecasts, and the ranges for 2029 and 2030 are wide because the data cannot see that far.
How this was researched
This article was researched on 26 September 2026 from Thailand's monthly and annual returns to UN Comtrade, the monthly reports of Thailand's Office of Industrial Economics, the annual and interim reports of Shennan Circuits, WUS Printed Circuit and Victory Giant (which quote Prismark), trade press, and the forecasting literature. The forecast was produced with a reproducible script that fits five methods, tests them on 22 past starting points and simulates 5,000 paths to 2030. Plant counts come from the MPBxChange register of PCB plants in Thailand, compiled from company, BOI and press records.
Sources
- data United Nations Statistics Division (2026). UN Comtrade: Thailand, HS 8534 printed circuits, exports and imports, monthly, January 2015 to May 2026 (the link opens May 2026; change the period for other months). UN Comtrade database, public API. back to text
- data United Nations Statistics Division (2026). UN Comtrade: Thailand, HS 8534 printed circuits, exports and imports, annual, 2015 to 2025 (the link opens the 2025 query; change the period for other years). UN Comtrade database, public API. back to text
- data United Nations Statistics Division (2026). UN Comtrade: HS 8534 printed circuits, exports to the world by reporting country, 2024. UN Comtrade database, public API. back to text
- official Office of Industrial Economics (OIE), Ministry of Industry (2026). ภาวะเศรษฐกิจอุตสาหกรรม เดือนกรกฎาคม 2569 (Industrial economic conditions, July 2026). Office of Industrial Economics. back to text
- official Office of Industrial Economics (OIE), Ministry of Industry (2026). ภาวะเศรษฐกิจอุตสาหกรรม เดือนธันวาคม 2568 (Industrial economic conditions, December 2025). Office of Industrial Economics. back to text
- company Shennan Circuits Co., Ltd. (2026). 深南电路股份有限公司2025年年度报告 (2025 Annual Report). Shenzhen Stock Exchange filing via CNINFO. back to text
- company WUS Printed Circuit Co., Ltd. (2026). 沪士电子股份有限公司2026年半年度报告 (2026 Interim Report). Shenzhen Stock Exchange filing via CNINFO. back to text
- company Victory Giant Technology (Huizhou) Co., Ltd. (2026). 胜宏科技(惠州)股份有限公司2026年半年度报告 (2026 Interim Report). Shenzhen Stock Exchange filing via CNINFO. back to text
- press Nikkei Asia (2025). Thailand carves out a less-glamorous AI niche: Printed circuit boards. KrASIA (republished from Nikkei Asia). back to text
- academic Hyndman, R. J.; Koehler, A. B. (2006). Another look at measures of forecast accuracy. International Journal of Forecasting, 22(4), 679-688. DOI 10.1016/j.ijforecast.2006.03.001. back to text
- academic Hyndman, R. J.; Athanasopoulos, G. (2021). Forecasting: Principles and Practice, 3rd edition, section 5.10: Time series cross-validation. OTexts, Melbourne. back to text
- academic Hyndman, R. J.; Athanasopoulos, G. (2021). Forecasting: Principles and Practice, 3rd edition, section 13.4: Forecast combinations. OTexts, Melbourne. back to text
- academic Hyndman, R. J.; Athanasopoulos, G. (2021). Forecasting: Principles and Practice, 3rd edition, section 5.5: Distributional forecasts and prediction intervals. OTexts, Melbourne. back to text
How to cite: MPBxChange (2026). Thailand's PCB exports: what the trade data suggests for 2026 to 2030. MPBxChange research. https://www.mpbxchange.com/research/thailand-pcb-exports-forecast-2026-2030